A tentative tool to measure the strength and sustainability of an NA.I've been writing here a lot about strong and weak NAs, hosting numbers and statistics. Now, how do you define a
strong NA? To measure whether an NA is strong, sustainable and supports the rest of the organization, I would suggest the following four criteria:
1.)
Hosting numbers: Sending a delegation is way easier than organizing a camp, so I guess on counting hosted programmes is better than counting sent delegates.
2.)
Number of chapters: The more chapters, the more sustainable an NA is. If one chapter goes down the drain, another one may grow instead. If one goes bankrupt, another may help out. The more (independent) chapters, the better.
3.)
EEC members: A strong NA should be able to contribute to the international work done. This becomes most obvious in the people that are in the top leadership positions of the organization.
4.)
Mosaic: International camps are a matter of hosting and sending delegations. A strong NA runs a year-round programs for locals as well. If a kerosin-tax is introduced, international travel gets more expensive, international camps will go down. Mosaic will stay.
Now, many organizations use indexes to measure criteria that are otherwise hard to grasp:
ESPN recently presented the
Soccer Power Index to rank national teams. Transparency International regularly sorts country by the
Corruption Perception Index and The Economist invented the famous
Big Mac Index.
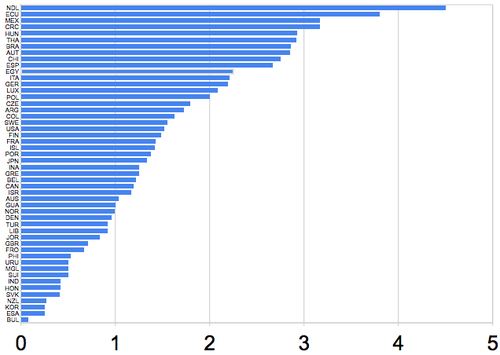
So, to bring all those criteria listed above that characterize a strong NA together in one number, I herby suggest the use of the "Balcony Index (BI)". It shall be calculated as follows:
BI = Hosted International Camps + Chapters + EEC-Members + Mosaic Projects
And here are the results for 2008, reduced to the top 20 (
full table here):
USA 58
SWE 48
ITA 45
NOR 32
BRA 31
CAN 27
FRA 27
GER 27
DEN 26
AUT 15
PHI 14
FIN 13
ESP 12
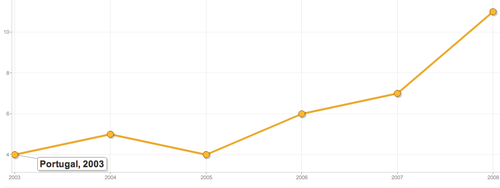
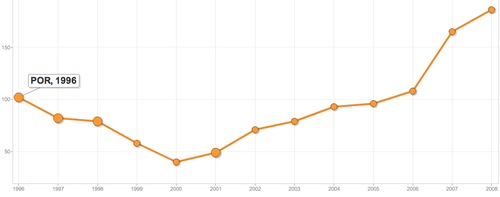
POR 11
COL 10
JPN 10
EGY 8
GBR 8
MEX 7
NDL 6
The ranking goes pretty much inline with my personal impression regarding the "strength" of the NAs - just France seems little too high up there. Interestingly there is somewhat of a gap after Denmark, so I think it's reasonable to speak of a G9, representing the strongest NAs: USA, Sweden, Italy, Norway, Brazil, Canada, France, Germany and Denmark.
Obviously, the BI has a few flaws:
- Interchange isn't represented at all.
- The four factors are not independent, in fact they depend on each other
- "financial strength" is not part of it, which may play a huge role in sustainability.
- Also there is no criterion for something as "brand awareness", "publicity" or "media attention".
Any suggestions for improvement are welcome.
Sidenote: When I presented the idea of the Balcony Index to Bebbe from IO during the RTF in Hamburg earlier this year, he suggested adding "number of cisv-shirts printed.", which I thought was funny and even a bit logical, but hard to track down.
![Reblog this post [with Zemanta]](http://img.zemanta.com/reblog_c.png?x-id=47afae7b-7e41-451e-af95-cf1d8517810f)